Long-term gas feeding behavior of the central supermassive black hole

Publication: Consistency of the Infrared Variability of SGR A* over 22 yr

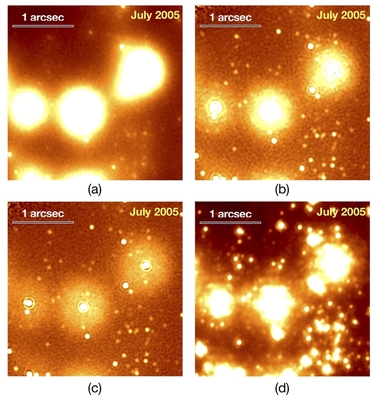
The Milky Way Galactic Center (GC), approximately 8 kpc from Earth, is host to the closest known supermassive black hole (SMBH). This makes it an excellent laboratory for studying the accretion properties of SMBHs. The accretion flow onto the SMBH at the GC gives rise to its radiative counterpart named Sgr A*. Sgr A* was initially detected in the near-infrared (NIR) with adaptive optics observations in 2002. While earlier data exists in form of speckle imaging (1995–2005) with shift-and-add technique, Sgr A* was not detected in the initial analysis. Here, we improved our speckle holography analysis techniques. This has improved the sensitivity of the resulting speckle images by up to a factor of three. See Figure 1.

Figure 1: Comparison of the different high angular resolution techniques used to image the GC. The early data has been analyzed with (a) Shift-and-add, (b) the original implementation of speckle holography, and (c) the new implementation presented in this work. AO data taken at a similar time is shown in (d). The new speckle holography (c) improves the sensitivity of the final images by up to a factor of three compared to the initial speckle holography.

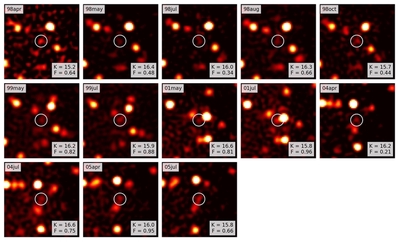
With the new implemented speckle holography presented in this work, Sgr A* is now detectable in the majority of speckle epochs covering 7 yr (Figure 2). Here we report new infrared (IR) measurements of the supermassive black hole at the Galactic Center, Sgr A*, over a decade that was previously inaccessible at these wavelengths. This enables a variability study that addresses variability timescales that are 10 times longer than earlier published studies.

Figure 2: Speckle holography images with new Sgr A* detections (white circles). For each detection, the K magnitude (K) and the bootstrap fraction (F) are provided. These are the first IR detections of Sgr A* in the late 1990s and early 2000s.

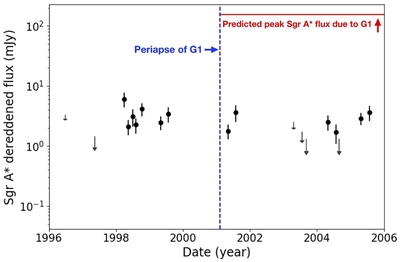
The brightness of Sgr A* in the speckle data has an average observed K magnitude of 16.0, which corresponds to a dereddened flux density of 3.4 mJy. Furthermore, the flat power spectral density of Sgr A* between ∼80 days and 7 yr shows its uncorrelation in time beyond the proposed single power-law break of ∼245 minutes. We report that the brightness and its variability is consistent over 22 yr. Finally, we note that the 2001 periapse of the extended, dusty object G1 had no apparent effect on the NIR emission from accretion flow onto Sgr A*. The result is consistent with G1 being a self-gravitating object rather than a disrupting gas cloud. See Figure 3.

Figure 3: Light curve of Sgr A* (1998-2005) and impact of G1ʼs closest approach on the brightness of Sgr A*. The points with errorbars are the confirmed detections of Sgr A*. The arrows mark the brightness limit of Sgr A* in other non-detected epochs. The blue dashed line marks the G1ʼs periapse (2001), and red line marks the predicted peak Sgr A* flux due to the closest approach of G1. No brightening or flares of Sgr A*, i.e., no apparent impacts of G1 on the Sgr A* IR emission, were observed between 2001 and 2005.
Zhuo Chen
Zhuo Chen
PHAST postdoc fellow

Related